Dr Prasad Modak was appointed by the Central Pollution Control Board as a consultant. I was assisting Dr Modak along with my team members Vishwa Vijaysheel and Jay Mehta
The scope involved analyses, visualization and interpretation of water quality data collected through manual monitoring and automatic continuous monitoring stations.
Data from eighty (80) manual and thirty-six (36) automatic water quality monitoring stations of CPCB were analysed.
| Parameter | CPCB Manual Stations | CPCB Automatic Stations |
|---|---|---|
| Frequency | Monthly | 15 min Hourly averaged |
| Number of stations | 80 | 36 |
| Time-period of assessment | 2014-2018 | 2017-2018 |
| Water Quality Parameters analysed | BOD; DO; Total Coliforms; Fecal Coliforms and pH | NO3; COD; BOD; DO; TSS; NH4; Conductivity |
| Analyses performed |
|
|
It was surprising that CPCB had done only rudimentary analysis of water quality data. This analysis fell short for any interpretation for identifying hot spots or to assess effectiveness of the measures taken under the National Mission for Clean Ganga(NMCG). It was a sorry state of affairs.
The data received was not well organized and not even cleaned! For example, there was no standard convention used to indicate missing data or for cases when the concentrations were below detection limits. Data cleaning (including finding the outliers) was the first step that we had to do, and it took a considerable time – perhaps as much time it took us to carry out analyses. That was quite a lesson learnt.
It is observed from the collected data that at CPCB, the date and time of measurement of water quality parameters through the manual stations is not fixed, and not proportional to the flow across the cross-section. Normally it is expected to draw a sample from the left, right and middle sections, composited and then analysed. Further, apart from parameters such as pH, DO, BOD and TC, analyses and interpretation of other parameters was rarely carried out
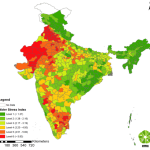
We used Excel, R and Tableau as tools for analyses and visualization. I learnt many advanced functionalities of Tableau in this Project including how to create dashboards. Figure 1 shows a sample dashboard we created.
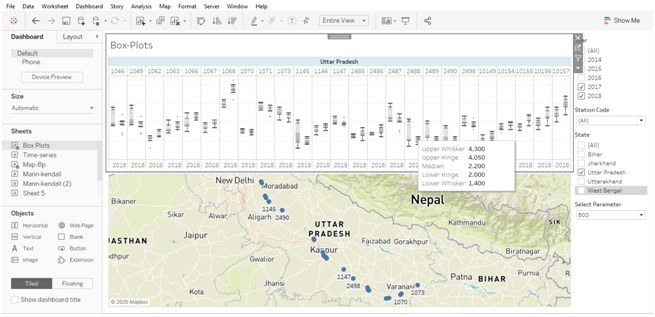
We applied tools such as non-parametric Mann-Kendal test for trend detection (direction and significance) and carried out advanced detection of violations over standards (based on magnitude of violations, percent exceedance and extent of contiguous violations). This helped in identifying the hot spots and stretches where there was water quality improvement. The stretches were categorized as “Watchful”, “No concern”, “Major Hotspot” and “Minor Hotspot”. Here the data collected at the automatic water quality monitoring stations was found to be useful. We also came up the recommendations on the minimum water quality sampling frequencies for the manually operated water quality monitoring program.
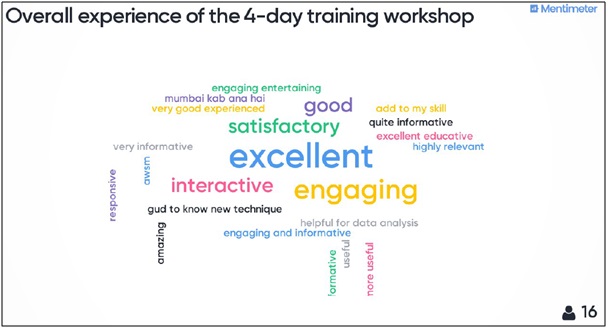
The most exciting phase of the project was training of the staff at CPCB working on the NMCG (National Mission for Clean Ganga)project. We conducted a 4-day hands on training using Tableau at CPCB that was attended by 20 officers. This program was followed by a 2-day advanced program for the Master Trainers conducted in the conference room of EMC in Mumbai.
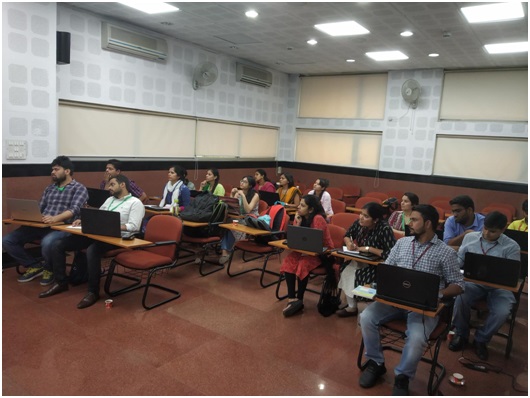
I discovered here my passion to teach, create engaging exercises and conduct group discussions on the visualization and interpretation of results. Our training programs were well received, as we got encouraging results of course evaluation.
Key Outcomes of the project included:
- Report on advanced statistical analyses of Water Quality Data on river Ganga (2011-2018) with several recommendations on hot spots, identification of stretches showing improvement, optimum sampling frequencies
- Improved data organization
- Installation of Tableau at CPCB with dashboards
- Capacity building of the Staff at CPCB
Write to us at emcblogs@emcentre.com if you are interested to know more about this project. Let us know if can be of any help to you.