Understanding water stress is particularly important to plan strategies for managing our water resources. According to Pacific Institute “Water stress” refers to the ability, or lack thereof, to meet human and ecological demand for water. Compared to scarcity, “water stress” is a more inclusive and broader concept. It considers several physical aspects related to water resources, including water scarcity, but also water quality, environmental flows, and the accessibility of water.
I was involved in an assignment to prepare a Water Stress map for India at district level. One of the large Corporates in India commissioned EMC to prepare such a map that would enable designing their CSR projects focusing on water using a science-based approach.
We started reviewing previous work carried out by various researchers to come up with a methodology for identifying water stressed areas. The review lead to following observations.
- Most work done in the past on water stress focused on water availability.
- Except Water Risk Index of World Resources Institute, none of the researchers addressed quantity, quality and climate change related uncertainties. WRI’s index however “embedded climate change uncertainties” into water variability as an aspect of physical risk, and not treating as a separate stress indicator. Further the past work either considered a large spatial scale (e.g. region or country) or river basins and not administrative boundaries e.g. districts. This made identification as well as implementation of site-specific measures difficult.
- Those indices that attempted a smaller spatial unit (e.g. watershed or an administrative boundary) considered precipitation and groundwater data only. Surface water availability was not accounted for.
Based on these limitations and keeping the client’s interest in mind, we came up with a more comprehensive, objective and practical structure for Water Stress Index (WSI). The proposed formulation considers three important components such as Water Quantity, Water Quality, and Uncertainty, as depicted below (Box 1).
Box 1: Components of WSI
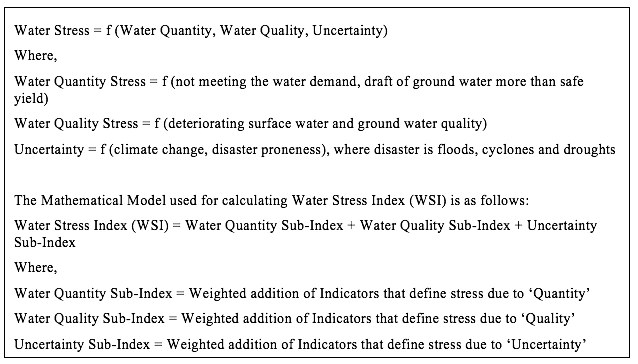
WSI was computed for India at district level based on the above mathematical model. Administrative boundary was preferred to watershed, because of two reasons – ‘data availability’ and ‘usability of index’. Index values would be more useful for decision makers for prioritization as well as for practical disposition of interventions.
The first step in calculation of WSI was to identify the indicators under three components – Water Quantity, Water Quality, and Uncertainty. Refer Figure 1 for the indicators identified to calculate the WSI. The next step was to identify the data sources for the indicators. Identifying suitable and credible data source and, peering and compiling the data for index calculation took a significant amount of time. The data available for administrative boundary in India such as rainfall, groundwater, socio-economic aspects were used. Latest data was collated from various secondary sources for calculating each indicator for water quantity, quality and uncertainty due to climate change. For the uncertainty, 25 years of horizon was considered. Both structured and unstructured forms of data were collected and processed to compute the indicator values. Some of the required data was available in Map forms. These data were pooled in by rasterizing as well as digitizing the maps using GIS. That was quite some work!
After sourcing and compiling data from various sources, we started building the index function for aggregation. This required that all indicators be assessed on a common scale for comparison. Hence, we normalized the indicator values on the scale of 0 to 10.
The calculation of WSI required assignment of weights. We used Analytical Hierarchical Process (AHP) to obtain the weights. Seven experts in water management were approached to carry out the pair-wise comparison of indicators. The AHP process was a great learning for me wherein, each expert gave their opinion and understanding on indicators used for WSI. Weights given by the experts during the AHP strengthened the index formulation. Each indicator was compared with the other for its significance to express the water stress. This led to the calculation of Sub-indices and the final composite WSI for each district. Figure 2 shows the WSI developed for India. We used ArcGIS to represent the index spatially on India map. This map is now included in the publication of the Global Technology Water Group of the Department of Science and Technology, Government of India.
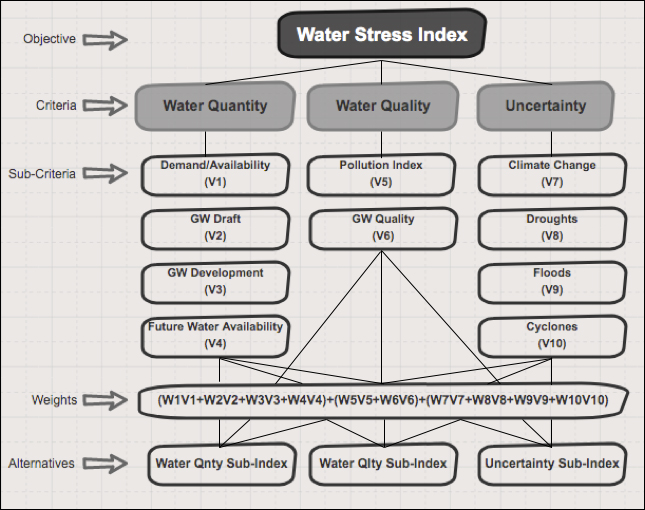
Figure 1: Analytical Hierarchy Process used for calculating Weights for each Indicator
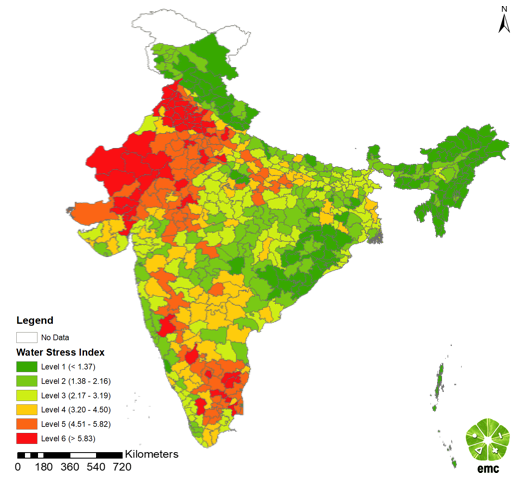
Figure 2: Water Stress Index – India
After identifying water stress at District level, we further granulized the water stress at Tehsil level. Tehsil level (in the most stressed Districts) analysis was carried out in four States – Gujarat, Rajasthan, Maharashtra and Tamil Nadu. Refer Figure 3 for the water stressed Tehsil identified in the State of Rajasthan. The Tehsils were selected based on following three conditions – contiguity of the water problem, impact factor considering the population under risk, and access to drinking water, sanitation and irrigation facilities. This helped the Client in identifying one or two Tehsils in the State that could be taken up for CSR interventions.
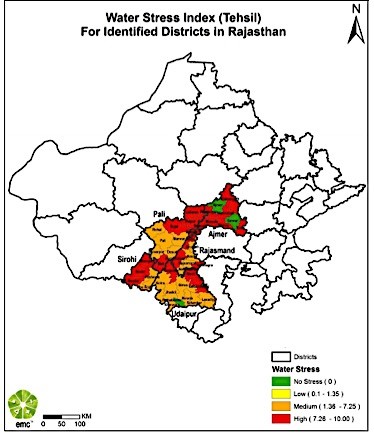
Figure 3: Water Stress Index – Tehsil Level for the State of Rajasthan
Sub-index level maps – such as Quantity, Quality and Uncertainty were also created to help the Company to design interventions that can be rejuvenating (for addressing quantity issue), corrective (to tackle the water quality related issues) and adaptive (for addressing uncertainty, especially in the interest of agriculture). Thus, our work guided the Client to not only prioritize the geographical areas to relive the water stress but also to understand the focus of intervention.
Indeed, the science-based approach helped!
I learned a lot from this project. Data analytics and tools such AHP were new to me. I could bring in my climate change related expertise and see its value. Working in team to deliver the outcomes in a short time was some “stress” no doubt but was lots of fun!
The Outcomes
- A report on ‘Identification of Water Stress Areas in India’ that identified water stressed Districts and Tehsils of India.
- A compendium of interventions to address water related issues. Each intervention contained the explanation, brief design, case studies as well as broad estimates. The compendium helped the Company in identifying the suitable CSR interventions.
- Inventory of national level schemes related to water as operational in the region with a list of NGOs and institutions actively working in the water sector. This helped the Client to identify local partners to implement the CSR interventions.
Write to us at emcblogs@emcentre.com if you are interested to know more about this project. Let us know if this can be of any help to you.